Looking Back to Move Forward
Apr 29, 2025


RGF clients share a common, forward-looking view built on planning for uncertainty and mitigating catastrophic outcomes. Seeking experienced, principles-based advice centred on a collaboratively derived financial plan is a value shared by generations of savers, investors, and retirees planning for their defined prosperity.
Given most RGF clients live and work in Canada, the economic impact of Canadian policy affects our human capital productivity, the share we pay to government(s), public pension responsibility, mortgage interest rate structures, and on through to our home affordability and health-care access. Our proximity to our southern neighbours coupled with a shared, curated, and concentrated media experience leaves us open to comparison, albeit obfuscated by scale, currency, democratic system, or social norm.
Nonetheless, the economic performance of the United States and Canada has been a subject of interest for decades, and lately of some scrutiny and debate, given our intertwined economies and trade relationships. Yet, despite similarities, their economic trajectories have differed due to varying policies, industries, and global influences.
When we compare economic growth of the US and Canada over 25 years using GDP or GNI per capita, both countries showed very similar progress from 2000 to 2015, with the US maintaining a steady income advantage gap, and Canada growing at a parallel rate shrinking the percentage difference.
That is until a directional downturn in Canada started a widening divergence between the average individual economic prosperity in the two countries.
The US’s GDP has grown significantly, and consistently, with occasional dips during economic downturns (2008 financial crisis and 2020 COVID-19 lock downs) driven by its diverse consumer economy, technological and innovation advancements, and despite its globalization drain.
Canada’s GDP growth had been steady, supported by its natural resources and trade relationships, with the same two major dips. But the pace slowed dramatically in the last decade as taxation increased, domestic reinvestment stalled in red tape, and productivity waned. The GDP per capita shortfall in Canada has ballooned to ~$28.3K/year in 2023 from ~$12K/year from 2000–2015. Let’s consider some numbers to understand why.
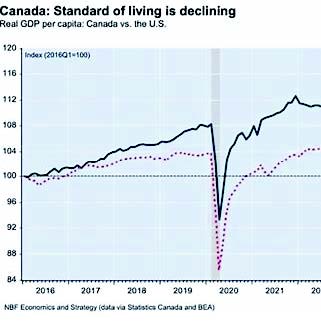
Canada has had the second-lowest real GDP growth of all 38 Organisation for Economic Co-operation and Development (OECD) democracies over the last decade, 90% below the average OECD nation, at just +1.4%. That’s not per year, that is total in 10 years! More Foreign Direct Investment (FDI) capital from
Canada is being invested outside Canada than foreigners are investing in Canada and at a divergent pace
(6.8% vs 4.0% yoy), so the net FDI deficit (now $811B) has increased by +311% from 2015 to 2023, according to StatCan.
Not surprising, given Canada’s significantly declining competitiveness in the World Bank’s Ease of Doing Business Index and the OECD’s FDI regulatory restrictiveness index (where we rank 3x higher than the average of our G7 peers!). Job creation, innovation, and GDP growth are difficult without a favourable investment environment.
Another 2015 policy change was our government’s switch to spending on credit, something all of us agree is unsustainable. Our annual federal budget increased by 90%+ to $538B in 2024 from $282B in 2015. With the highest 10 years of deficit spending, national debt grew to $1.25T from $612B, a~$30K share each. How, we wonder, when taxes increased 40% to an average tax burden of $47K/year, according to the Fraser Institute? Well, spending increased even more! The federal government workforce has increased by 43% since 2016 to 368,000 employees from 257,000 employees (excluding RCMP, military, and Crown Corporations).
Presumably, to ensure service levels modelling the post office and to ensure productivity growth rivalling our GDP, payroll and pensions increased by +78% to $70B from $39B.
StatCan provides bleak insight into the erosion of Canadian prosperity over the last decade by drilling into rising costs. In 2015, the average after-tax family income was ~$70K and the cost of living (COL) was ~$50K, leaving some “prosperity” surplus. Today, the average after-tax family income has risen to ~$92K but the COL is ~$99K, leaving a shortfall, propensity to borrow, and dependency on government assistance.
According to StatCan, the average family is accumulating approximately $16,000 more in debt annually. This increase is due to rising costs in consumer debt, mortgage payments, and utility bills, which have surged by 115%. Additionally, energy prices have climbed by 39% and are expected to rise further with the implementation of Carbon Tax 2.0. Property purchase taxes and property taxes, linked to the Canada Mortgage and Housing Corporation’s average housing prices, have also increased by 61%.
It is no surprise that consumer bankruptcies are up +58% and corporate insolvencies are +80% higher than a decade ago. We carry the highest consumer debt load of any G7 countries by far (195%).
This makes the prospect of economic resiliency and consumer-led recovery less likely in the face of shocks. We need policy change.
When it comes to trade and tariffs, Canada is more reliant on the US (>70% of our goods and services exports) than any other nation in the world is reliant on a trading partner. Whether we like it or not, our total exported trade to the US amounts to ~$1,800/ year per capita (given their much larger population), while US imports to Canada are ~$10K/year per capita. In other words, US imports are more than 5x more influential in our prosperity than our exports are to them. Furthermore, reciprocal tariffs on ~$10K US imports increasing Canadians’ COL when our per capita GNI is ~$53.4K/yr will hurt us a lot more than tariffs on $1,800 of Canadian imports within US per capita GNI of ~$81.7K/yr.
We need to find a different, more competitive, sustainable path forward to grow the Canadian economic
pie beyond the “great reset” of excessive tax-and-spend philosophies. The numbers here are Canadian, but the views expressed are not necessarily those of RGF or your advisor. It is up to each of us to choose our collective path for the next decade and beyond.
Did we choose wisely? ■
Tax Planning
Tax planning can be also complex and hard to understand, because everyone's situation is unique. Below, we look at different financial situations and how we'd suggest each person proceed to get the most favorable result.
Learn More